

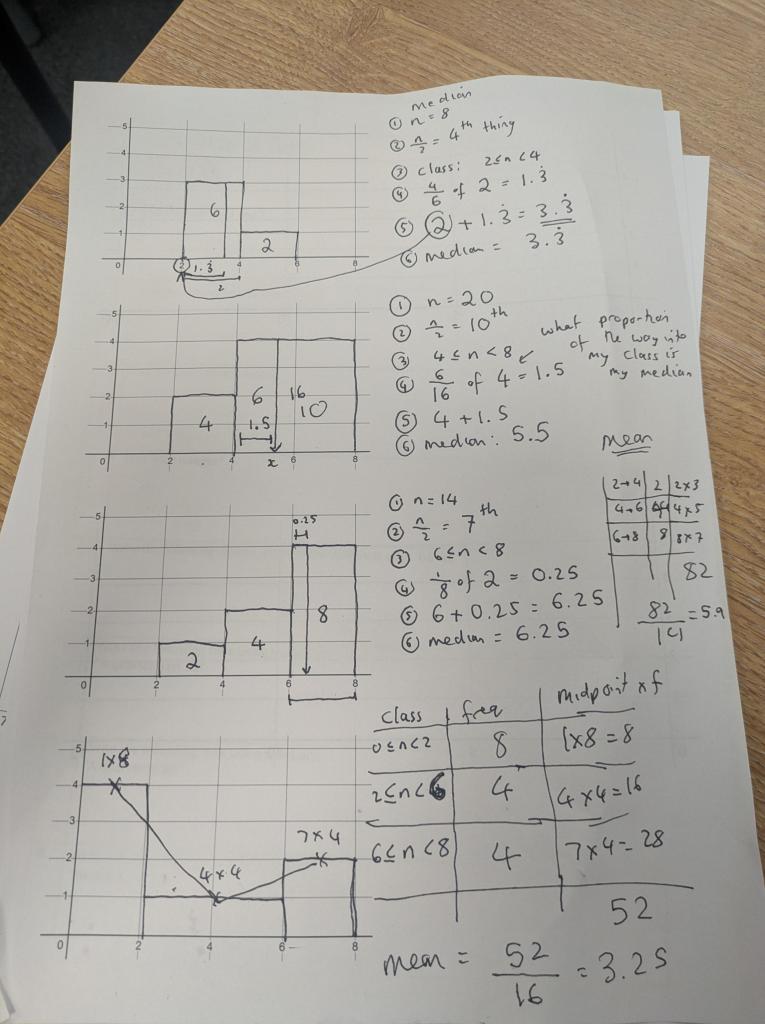
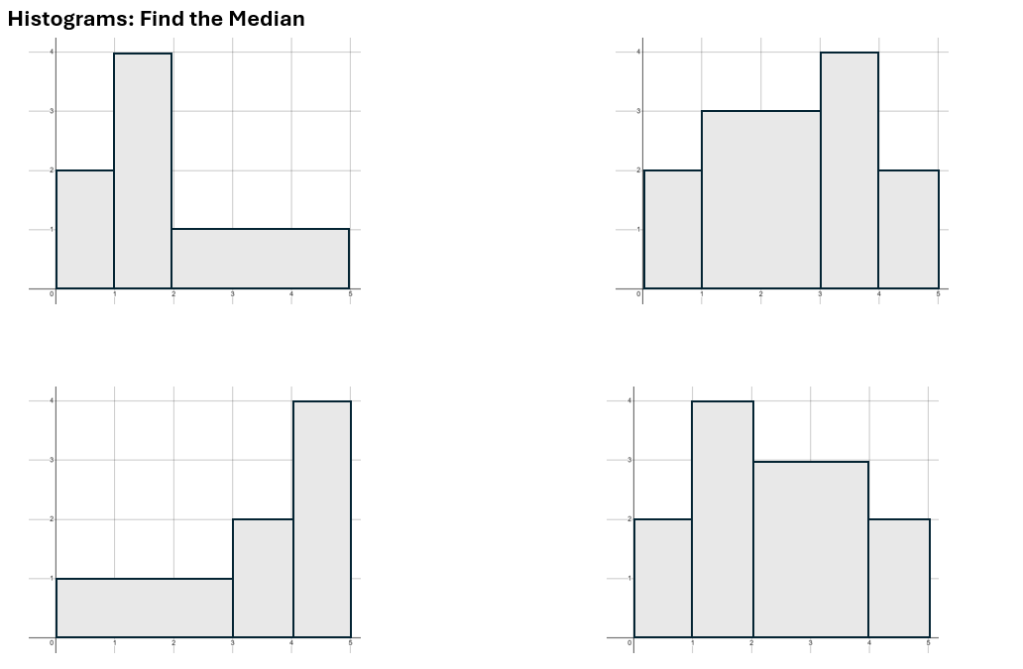
Finding the median from a Histogram is one of those A Level Topics that sneaks into GCSE and that I had actually not prepared to teach when it came up whilst we were doing some of the fantastic Focus Tasks from Mathsbox. I quickly printed off some blank axis from Desmos and then went about writing some simple histogram questions under the visualiser.
The issue with making these questions up on the spot is that they weren’t all “nice” and didn’t really build up in difficulty properly.
So I speedily during lunch put together the following PPT that introduced the idea of Linear Interpolation slowly

It actually was a lovely opportunity for some Variation Theory – Something I hadn’t really thought about in this context before!
There a bunch of these questions in the PPT and then build up to some more tricky questions – but all nicely contained on a small grid which was nice
Also meant that we could also do mean from a Histogram etc.
Always fun to put something like this together that I can then use for my Y12s in the future.
Thanks for reading!
Let me know on bluesky if you have any thoughts
Natan

You must be logged in to post a comment.